 Yeast & Bacteria Bank
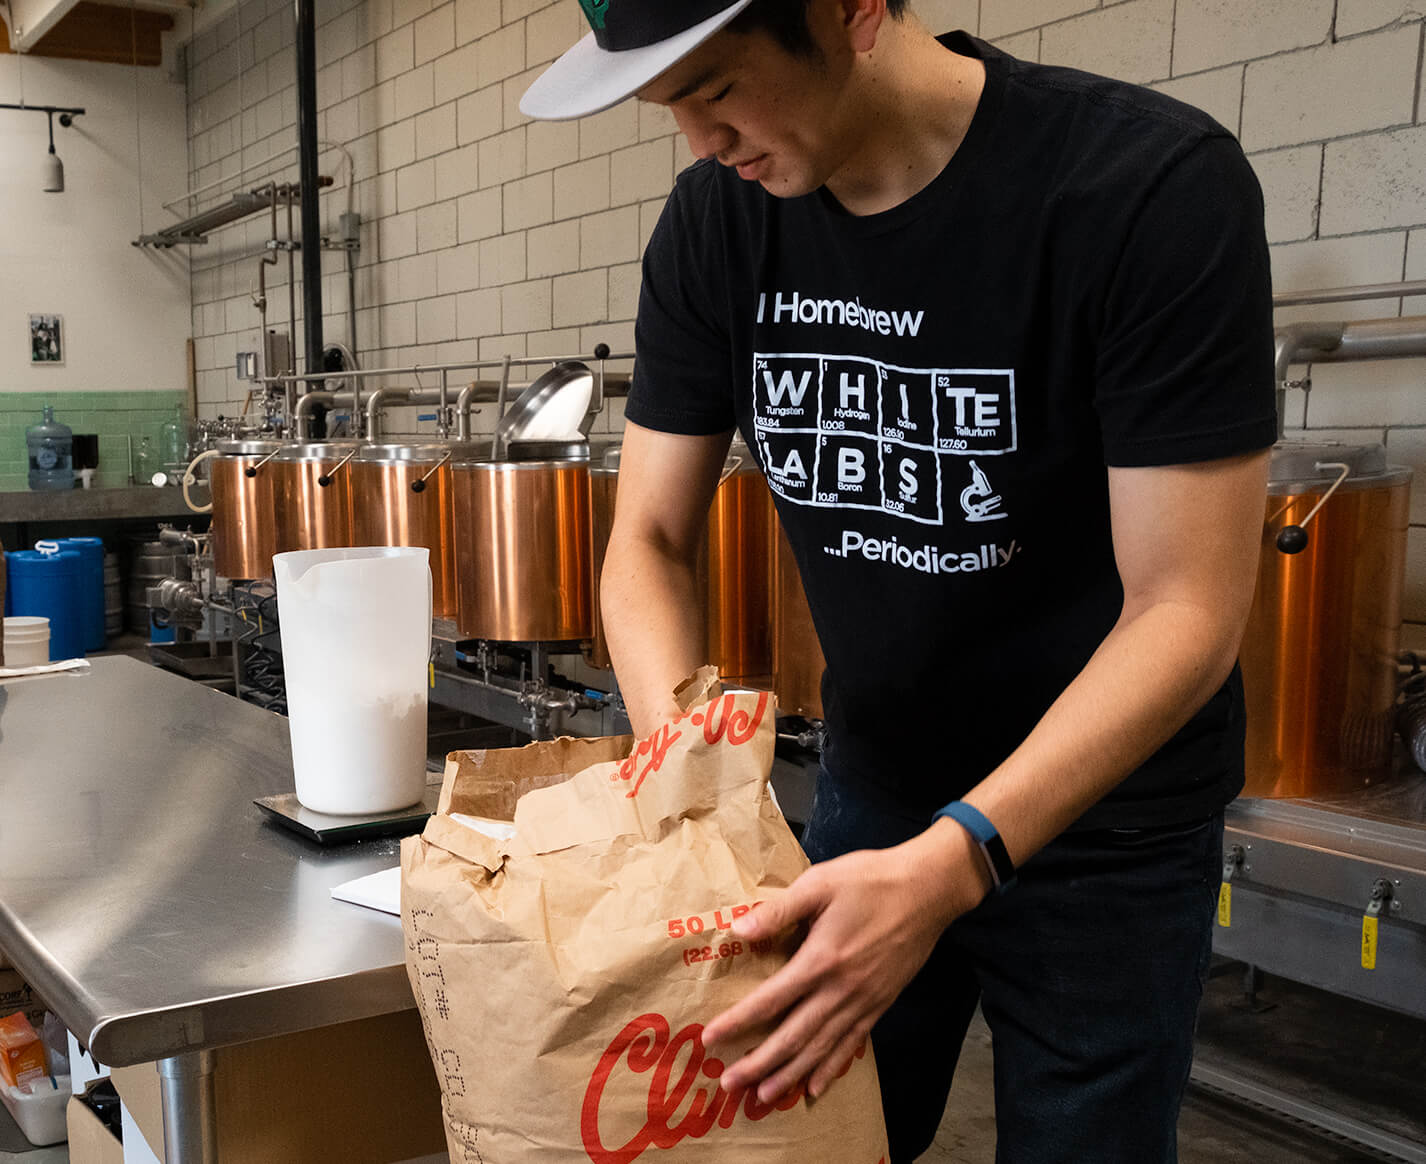
 Enzymes & Nutrients
 Lab Services
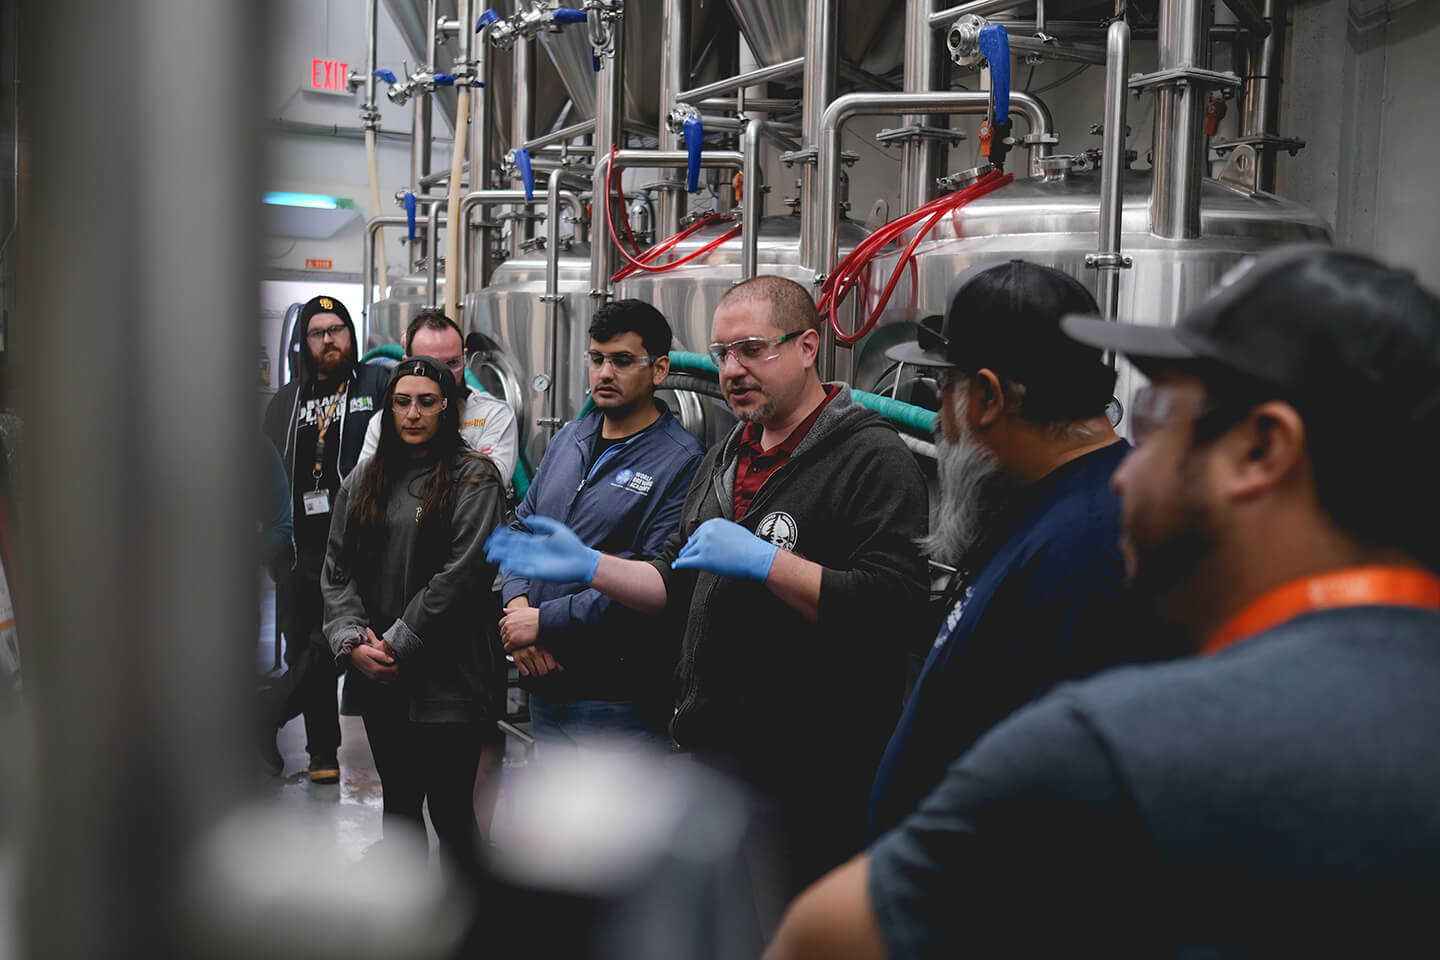
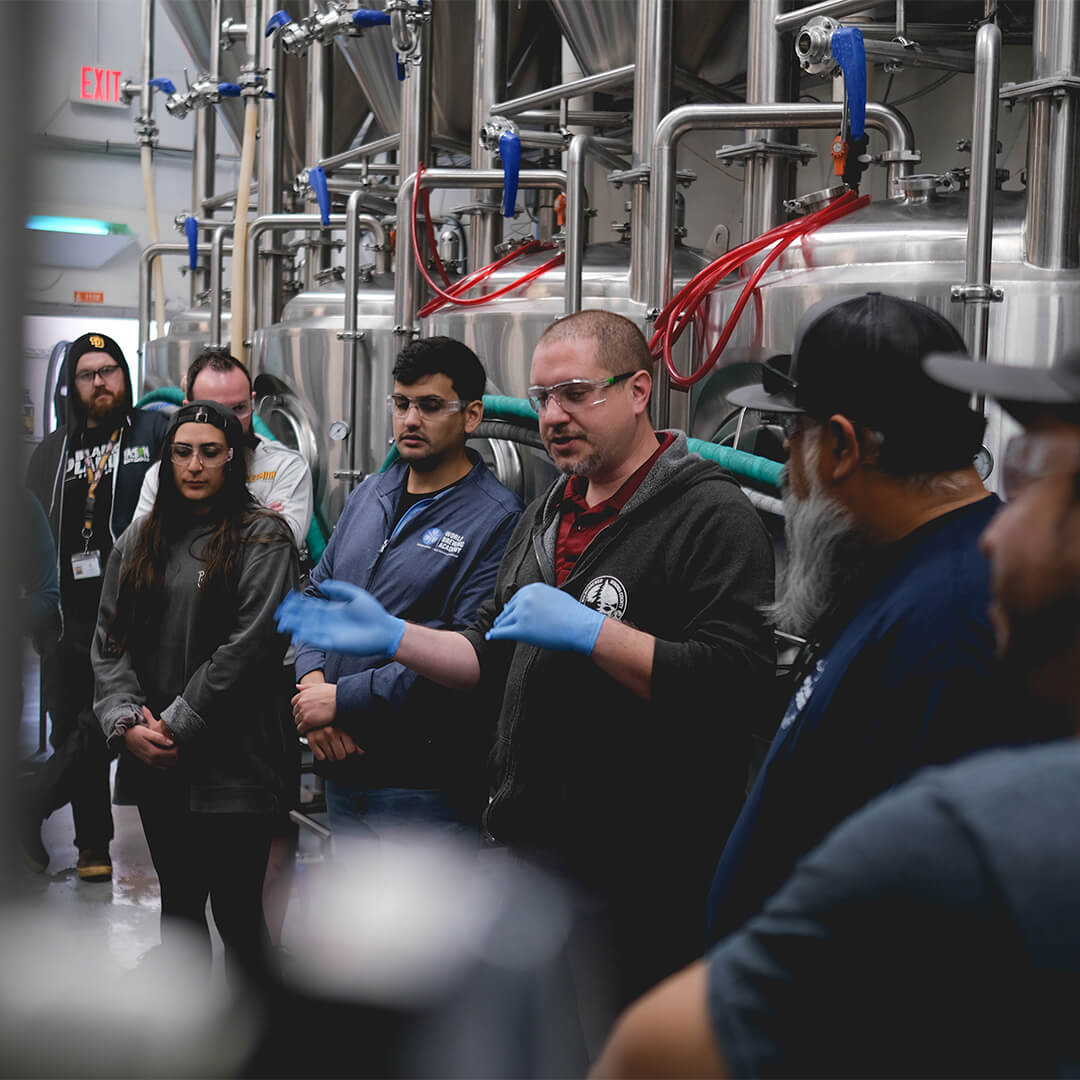
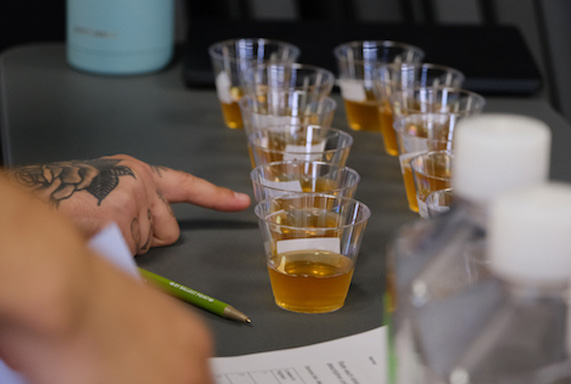 Education
 Merchandise


CHECK OUT WHAT'S NEW:

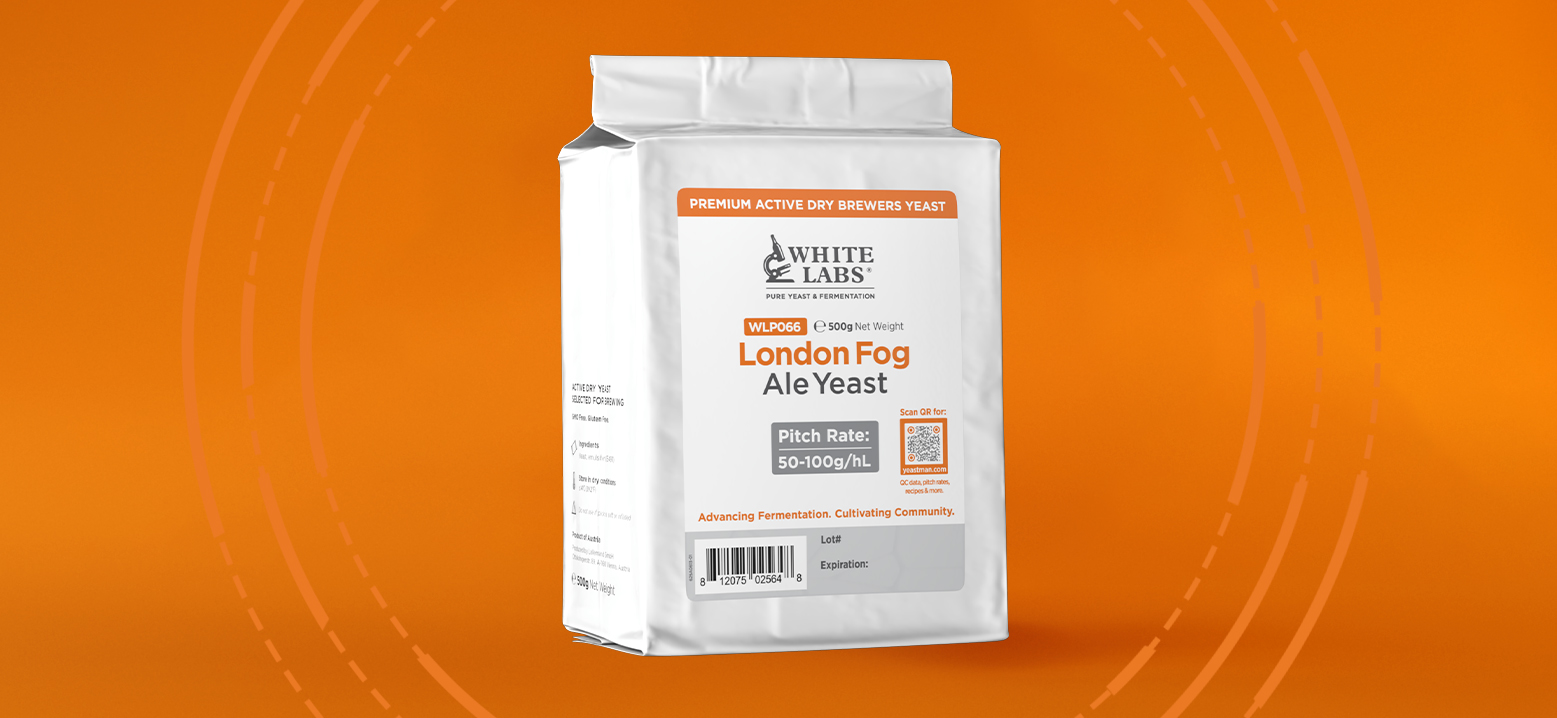

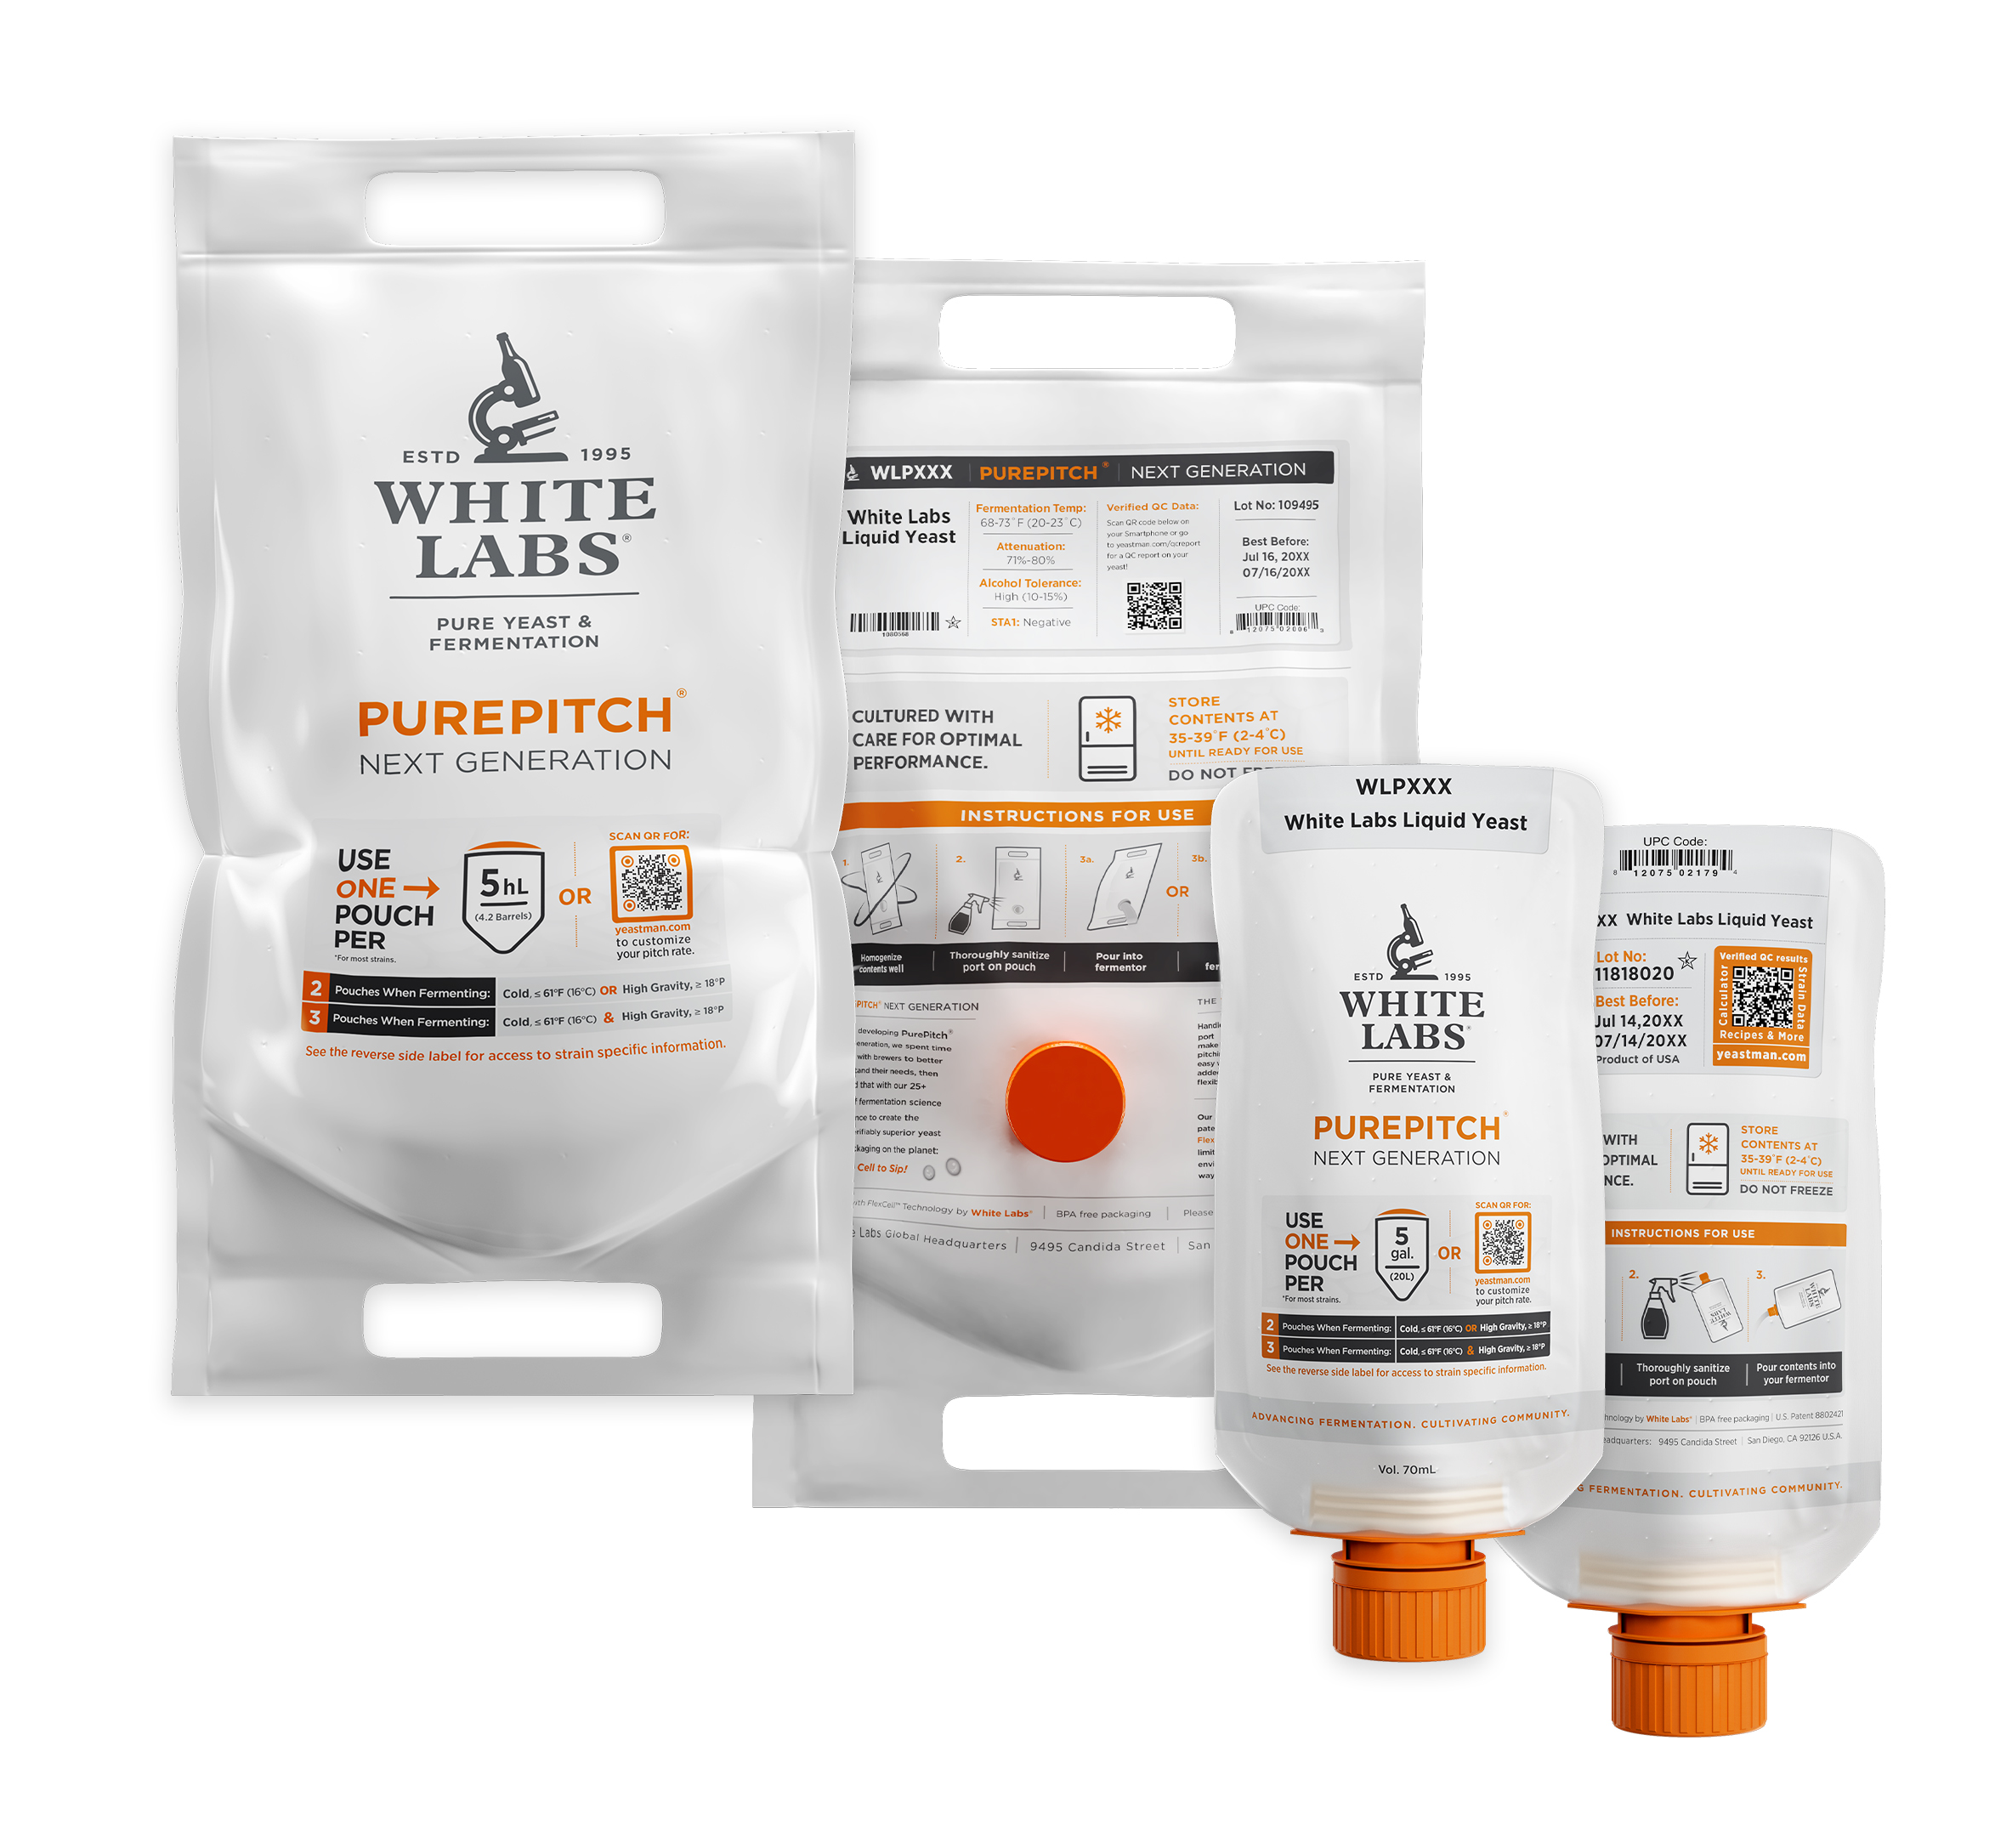
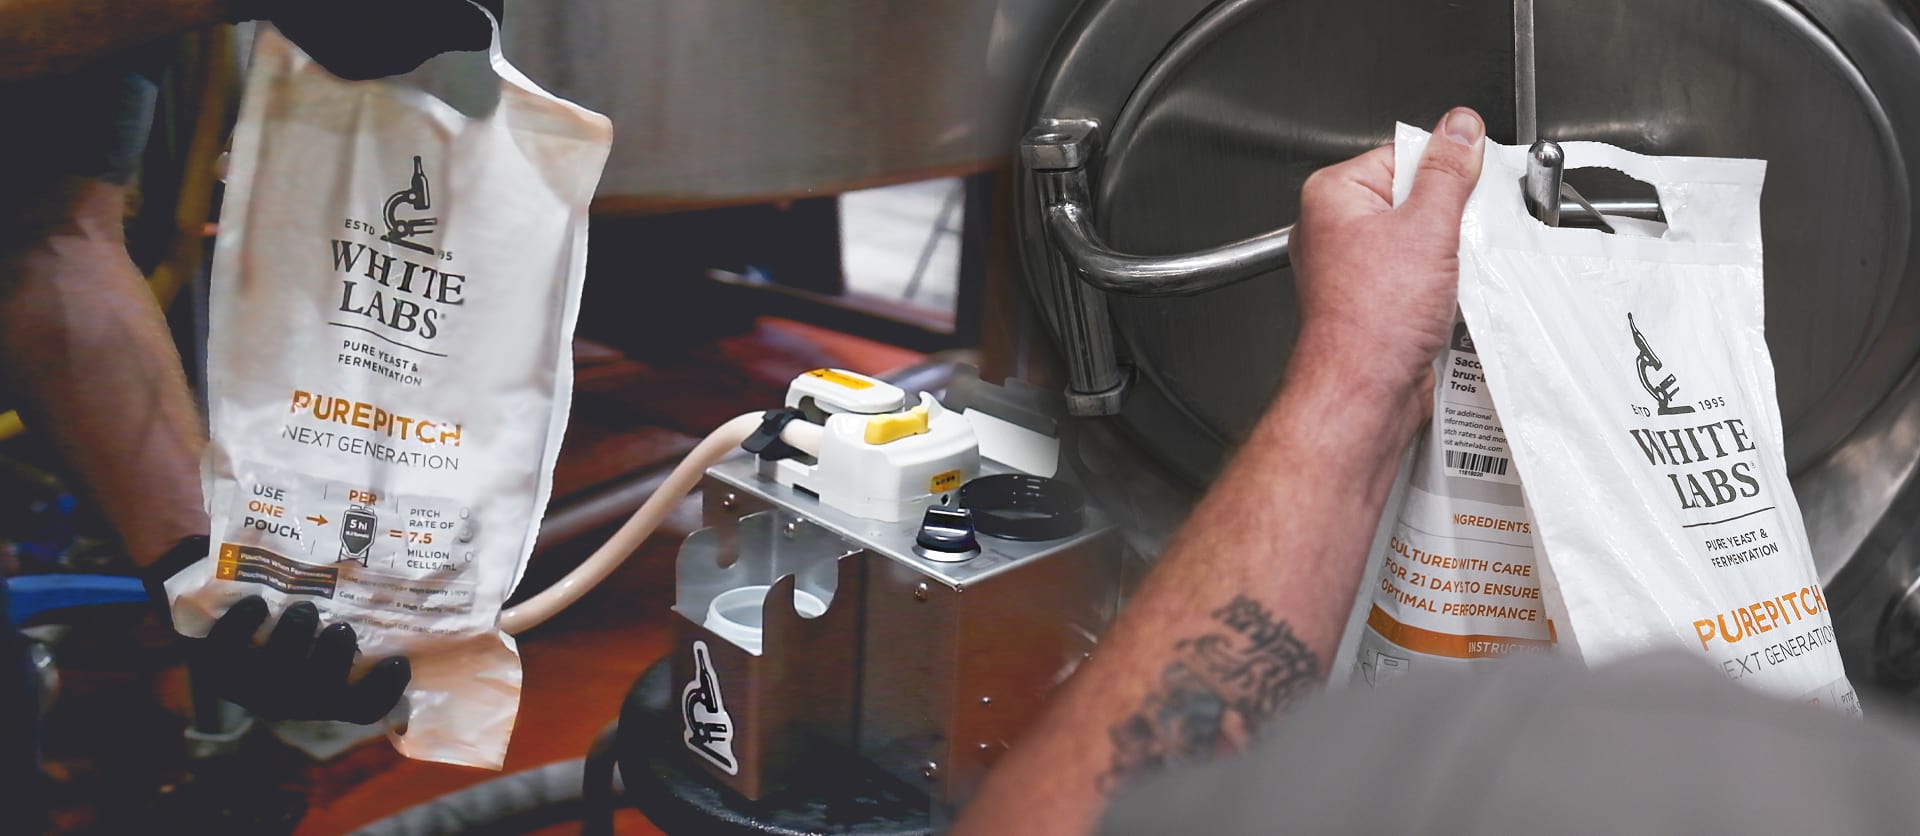
BREW DAYS JUST GOT EASIER
Never settling for “good enough,” our innovative spirit continues to advance the craft of fermentation, guaranteeing products that defy the status quo. We fuel the brewing community by offering new product innovations, educational resources, and a collaborative atmosphere – empowering brewers to make the best beer possible.
professionals homebrewers
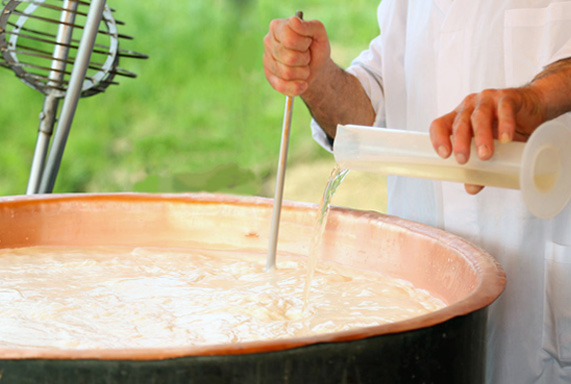
Fermentation Sidekicks
Ready to use enzymes to improve fermentable extract yield for yeast fermentation and optimal nutrient blends for improved fermentation performance for beer, hard seltzer, cider, mead and kombucha.
Enzymes & Nutrients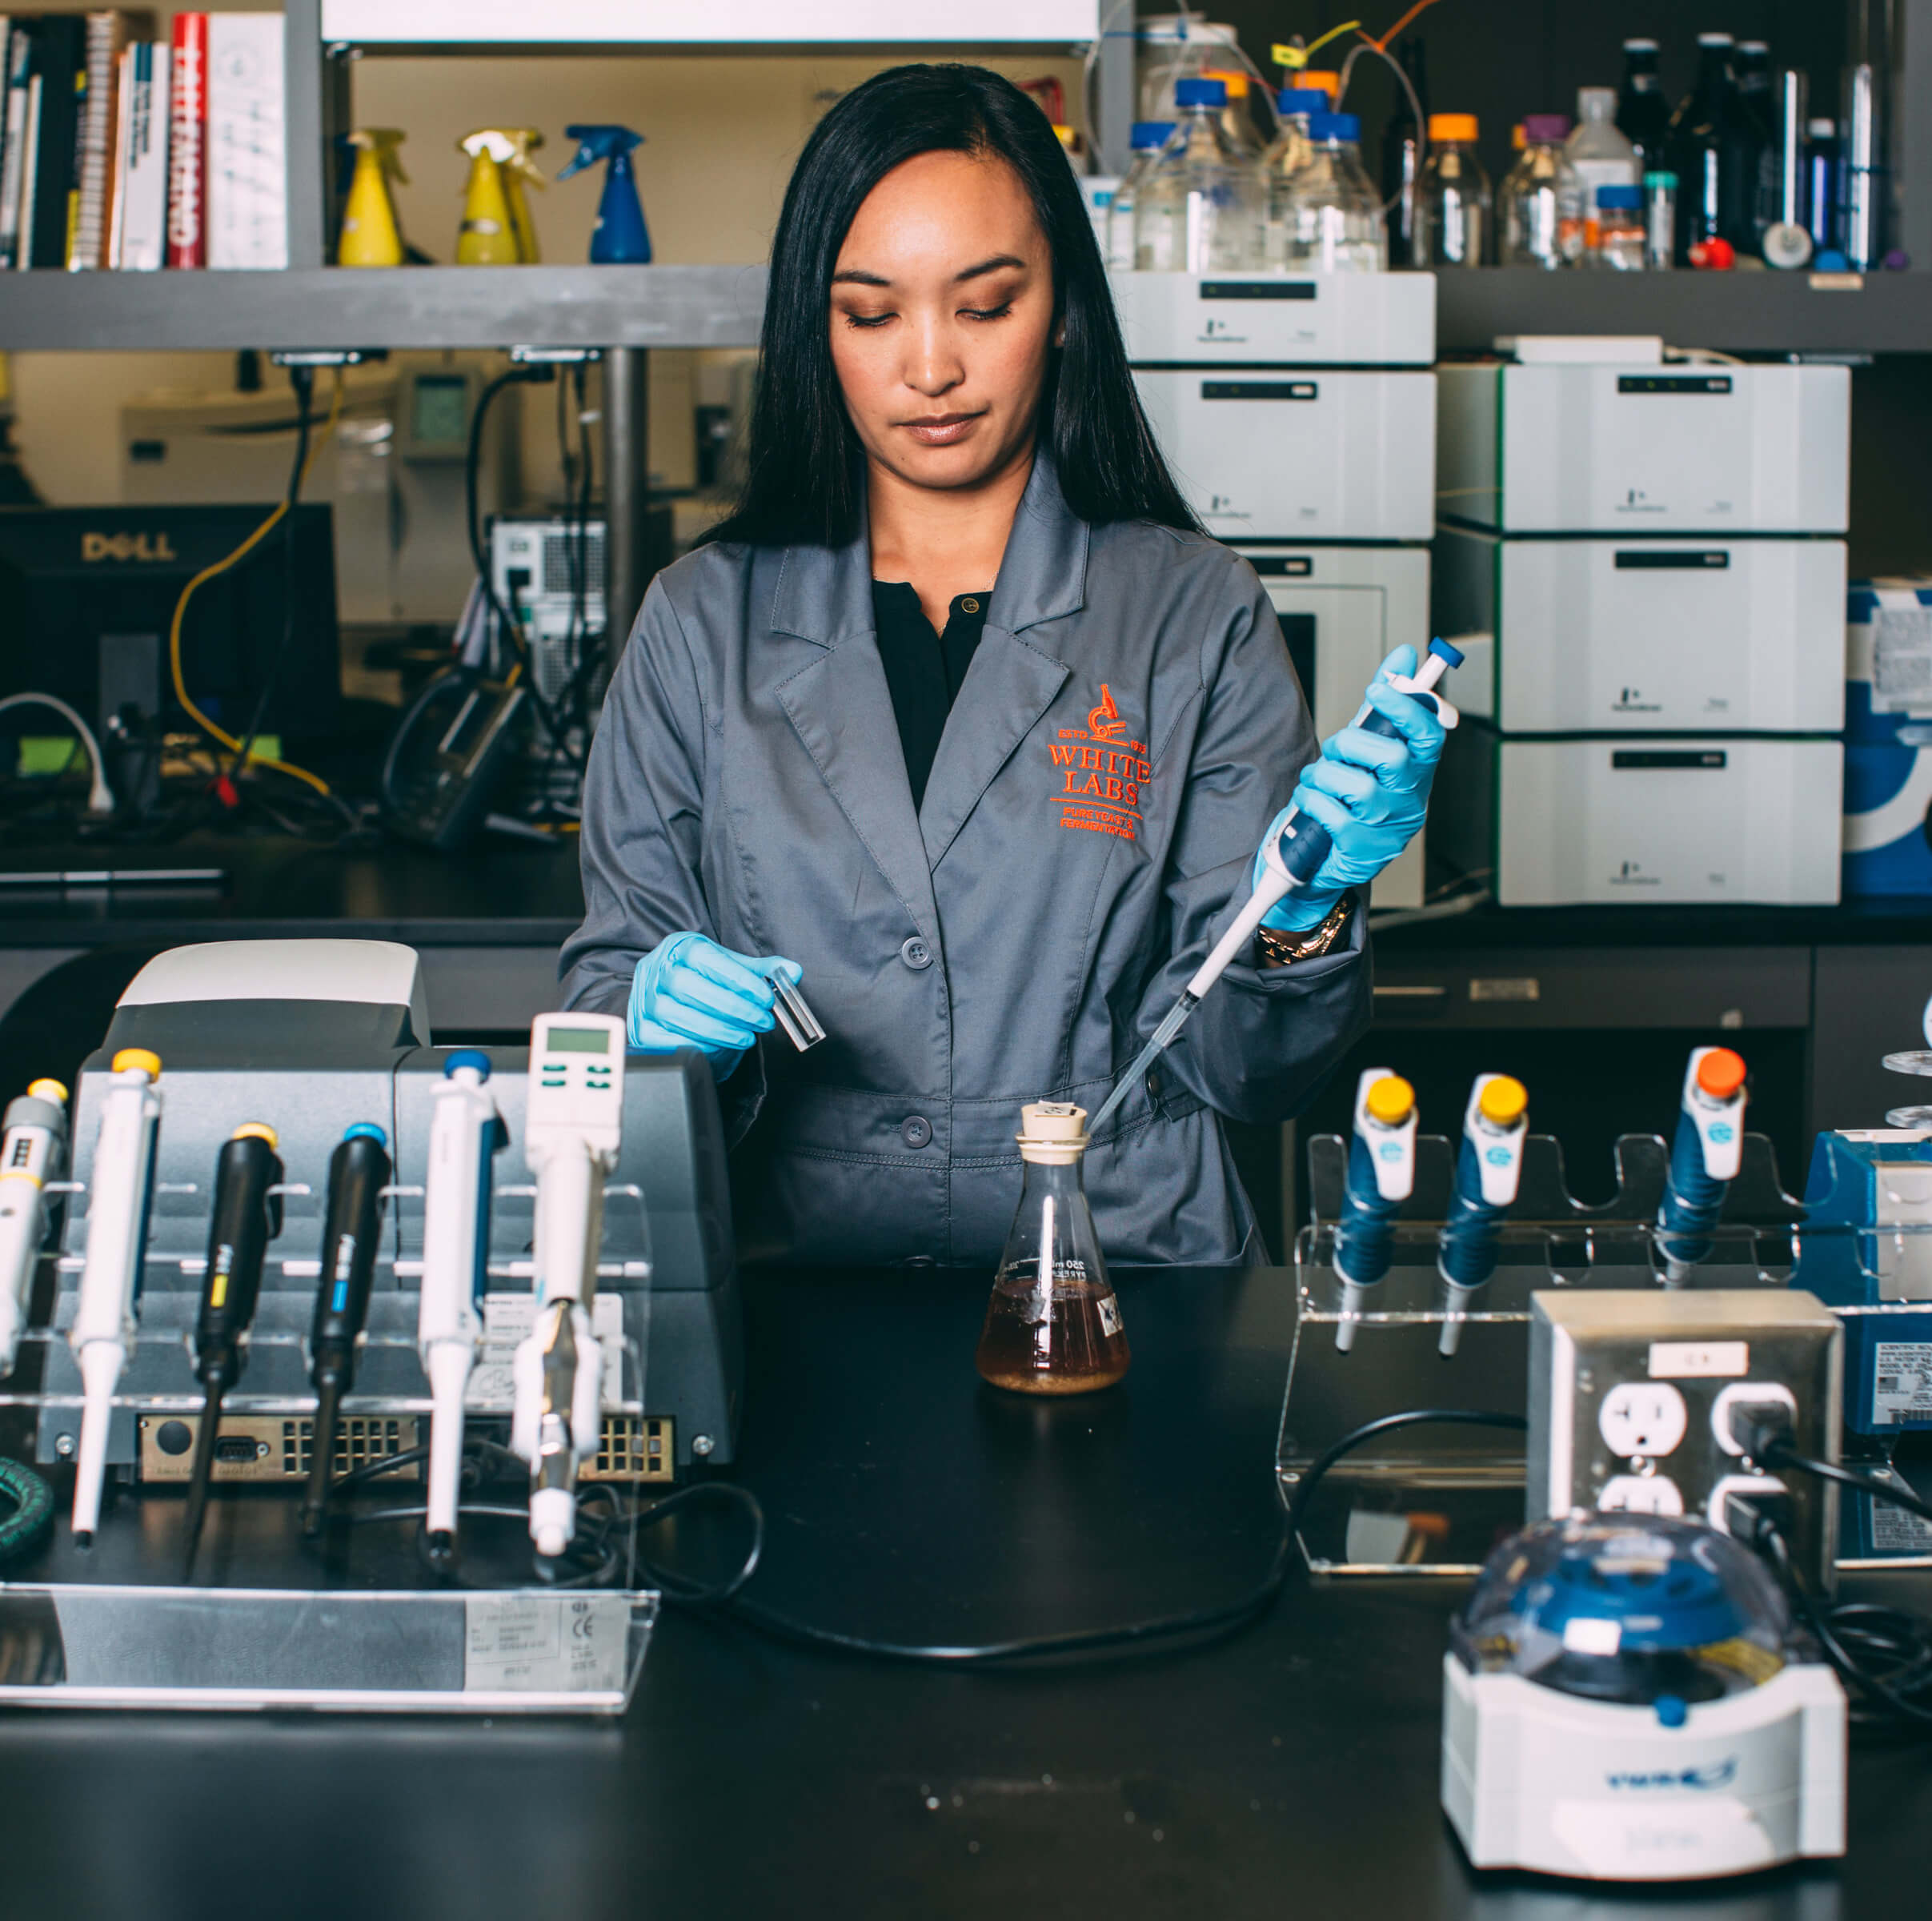
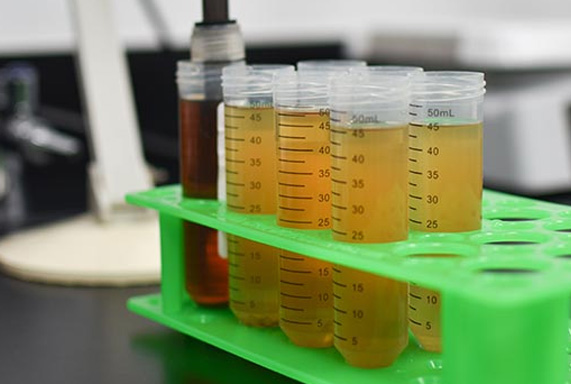
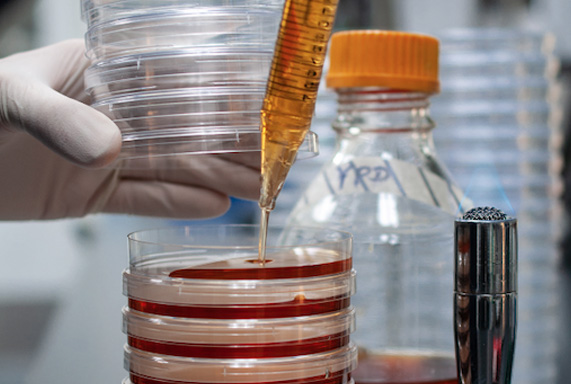
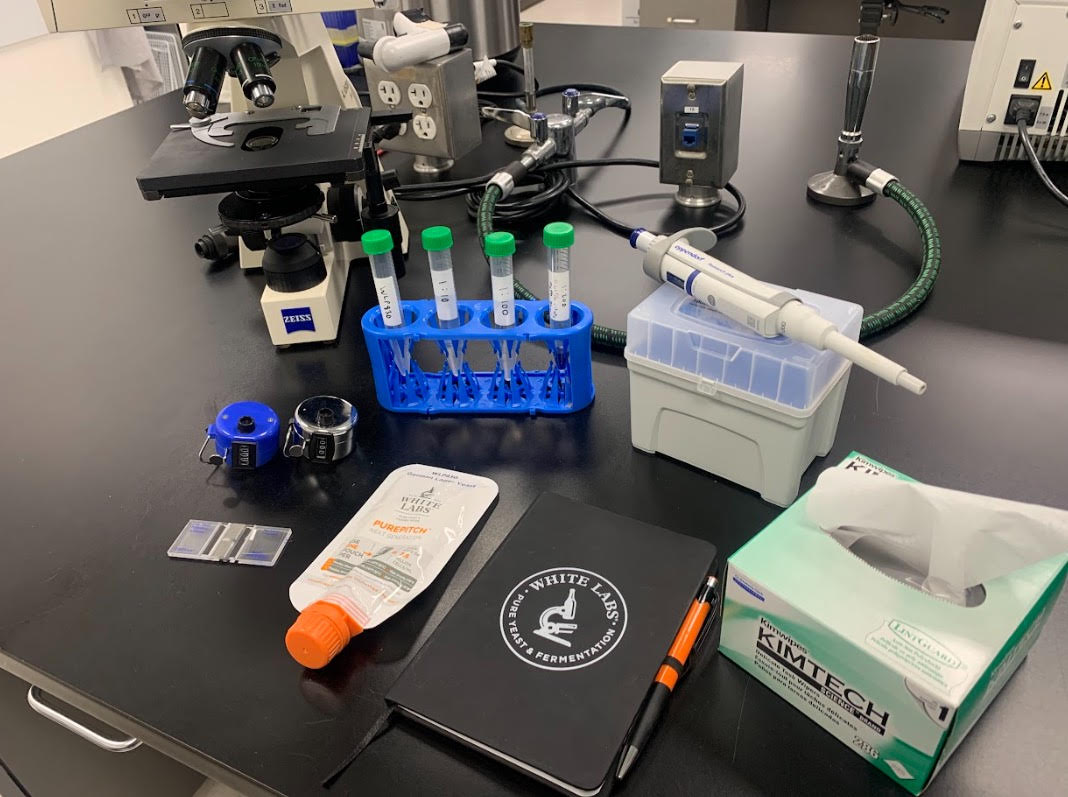
Experts To Support Your Beverage Analysis
White Labs Analytical Lab is an independent, certified laboratory. Tests are conducted using the strictest standards employing methods prescribed by the American Society of Brewing Chemists and AOAC. White Labs has several certified TTB beer chemists on staff. White Labs conducts tests and delivers results in a prompt manner, providing customers with information that is both timely and accurate.
Lab Services